
How Automated Manufacturing Performance Dashboard Enabled Real-Time Cost Optimization for a Beverage Manufacturer
Client
Clover, South Africa
Sector
Manufacturing
Geography
South Africa
Services
Data Engineering · Cost Analytics
Reduced
Downtime — equipment anomalies detected and acted on before stoppages occurred.
Operational EfficiencyControlled
Material yield and energy consumption — measurable cost savings across production lines.
Cost IntelligenceAutomated
End-to-end data pipeline — zero manual data extraction or spreadsheet compilation.
Engineering OutcomeThe Client
Clover Industries — South Africa's leading beverage and dairy manufacturer
Clover Industries Ltd is one of South Africa's leading beverage and dairy manufacturers, supplying a wide range of milk, yoghurt, juice, and nutritional products across the region.
With several production plants and a large distribution network, Clover depends on precise operational control to maintain product quality and cost efficiency in a highly competitive market.
The Challenge
Production decisions made on yesterday's data — in an industry where yesterday is too late
Clover's production performance data was dispersed across plant equipment logs, manual spreadsheets, and outdated modules. Line efficiency, machine downtime, quality checks, and resource consumption were difficult to track in real time.
Managers had limited visibility into the true drivers of production costs, and performance reviews were often based on outdated or incomplete information. As a result, cost overruns, bottlenecks, and inefficiencies went unnoticed until late in the production cycle, affecting output consistency and profitability.
Managers had limited visibility into the true drivers of production costs, and performance reviews were often based on outdated or incomplete information.
The Goal
Instant visibility, faster response, measurable cost savings
Clover needed one management view across every plant — replacing outdated spreadsheets and disconnected modules with automated, real-time production intelligence.
The Solution
A unified data engineering platform with an automated real-time OEE dashboard
A unified data engineering solution was developed to integrate data from all manufacturing lines into a single data warehouse. Automated pipelines extracted data directly from source systems without manual intervention. Real-time dashboards displayed key indicators such as OEE, material yield, energy consumption, and overall line performance.
Cost Driver Analytics
Structured analytics models connecting production performance metrics to cost outcomes — enabling management to see not just what is happening, but exactly what it is costing across materials, energy, and downtime.
Real-Time OEE Dashboard
A live operations dashboard displaying OEE, material yield, energy consumption, and line performance — updated in near real-time, accessible to supervisors and managers at their desks simultaneously.
Automated ETL Pipelines
Fully automated data extraction pipelines that pull production data directly from source systems without manual intervention — eliminating the spreadsheet compilation cycle and the delays and errors it created.
Unified Data Warehouse
A centralised manufacturing data warehouse integrating all data sources — plant equipment, QMS, ERP, energy monitoring — into a single, reliable, continuously refreshed foundation across all production sites.
The Result
Instant visibility. Faster response. Measurable cost savings across every plant.
Clover gained instant visibility into what was happening across its plants, allowing teams to respond quickly to performance drops and prevent unnecessary costs. Downtime was reduced due to faster detection of equipment anomalies, and production efficiency improved with clearer insights into bottlenecks.
The company achieved better control of material usage and energy consumption, leading to measurable cost savings. The automated dashboard enabled a shift from reactive reporting to proactive operational management.
Every production metric was accessible in real time, by every stakeholder from line supervisor to COO.
The automated pipeline meant that the early performance signals that precede unplanned stoppages — cycle time degradation, output drop, efficiency variance — were visible the moment they appeared, giving maintenance and operations teams the window to intervene before the line stopped.
The automated dashboard replaced the weekly performance review cycle with a continuous, always-current operational picture — changing the tempo of management from periodic to real-time.
With per-line, per-shift visibility into yield rates and energy costs, Clover's production managers could identify exactly where waste was occurring and make targeted interventions — generating measurable savings on two of the highest-cost inputs in beverage and dairy manufacturing.
What our clients say
Featured Case Study
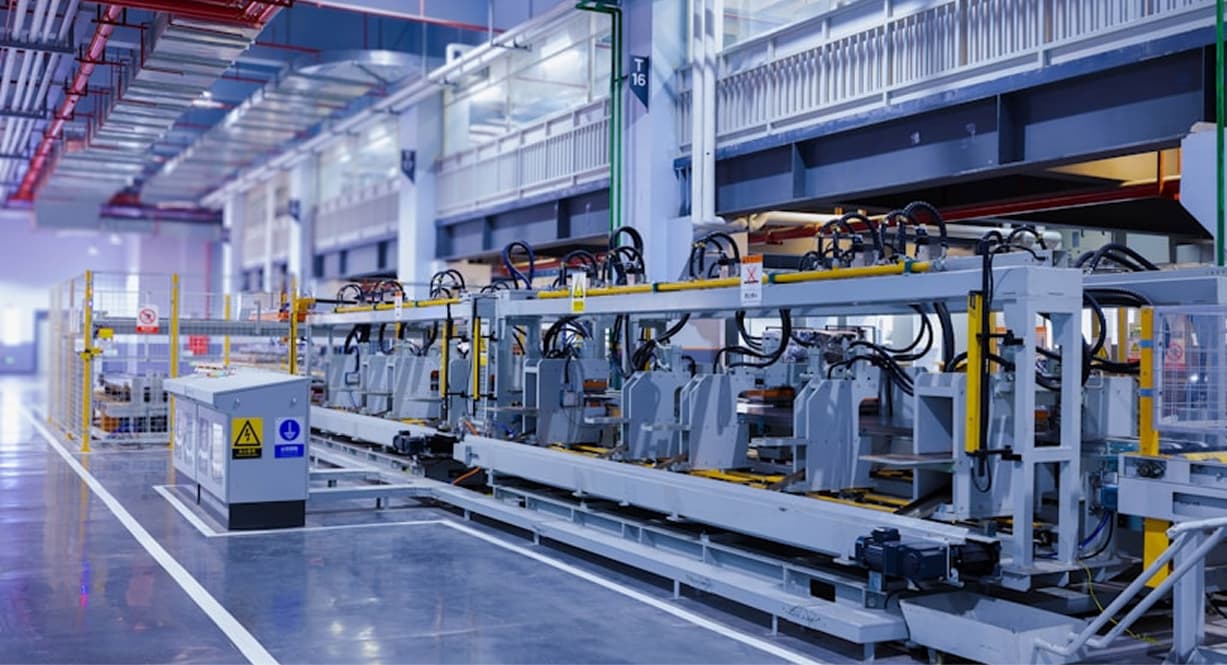
How BI-Powered Inventory Insights Reduced Stock-Outs and Excess Production for Bakhresa Group
Decreased Stock-outs — procurement teams acting on real-time reorder intelligence, not delayed reports.
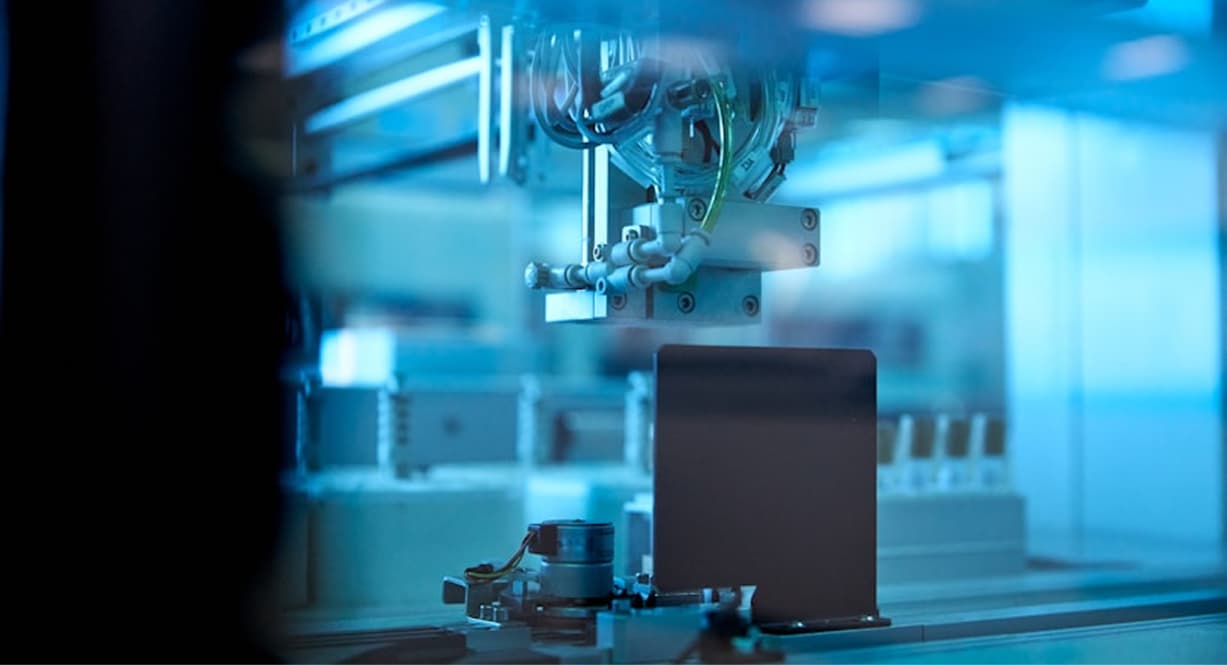
Unified Data Platform That Improved Product Quality and Supply Chain Performance in Manufacturing Industry
Reduced Defect rates — quality issues detected in-process, not after production runs.
Ready to make your data work harder?
Discuss how Delovox can unlock the full potential of your data and drive measurable business growth. The first consultation is on us.